Groundwater Fluctuation Map
Groundwater-level fluctuations represent hydraulic responses to changes in groundwater storage due to aquifer recharge and drainage as well as to changes in stress that include water mass loading and unloading above the aquifer surface
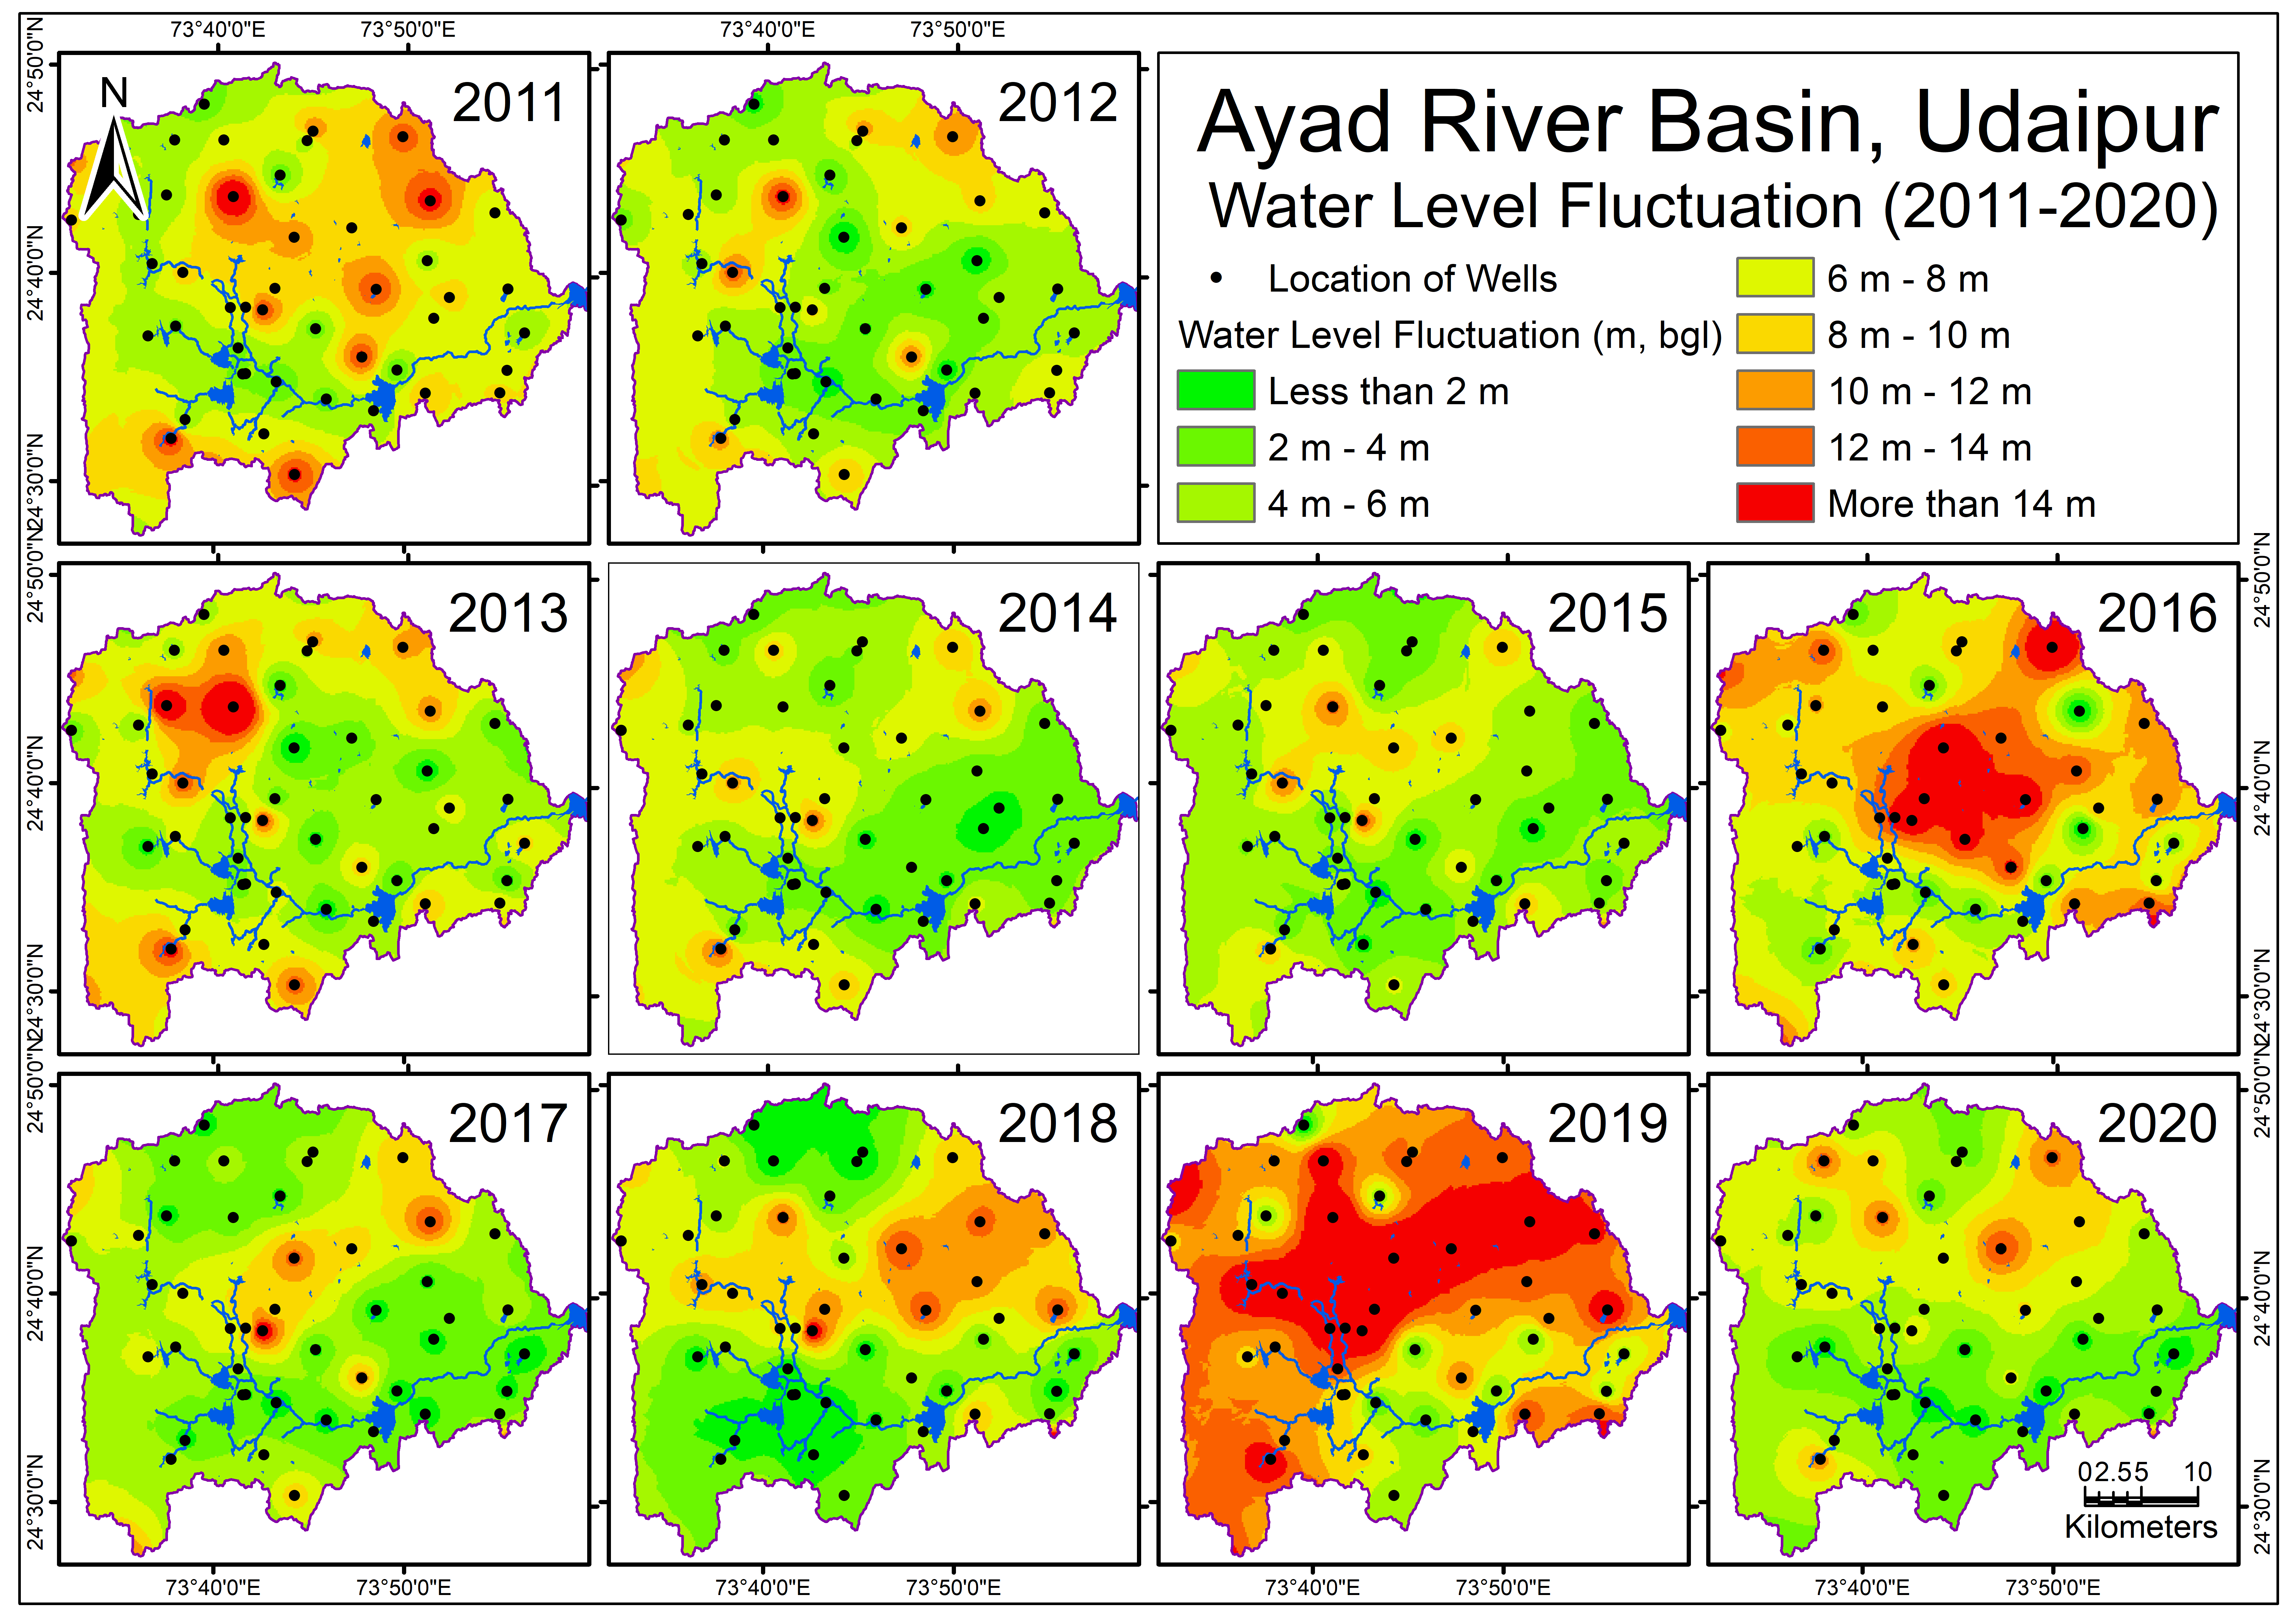
Source: Pre- and post-monsoon observations of groundwater levels from 2011 to 2020 has been collected from Ground Water Department, Jodhpur (Rajasthan). The water table fluctuation maps were generated showing the fluctuation in the pre monsoon period between the years.
Dimension: 1920x1080
Format: Png
Tags
Drainage Density Map Drainage Network Map Geological Map - Formation Geological Map - Lithology GroundWater Fluctuation Map v2 Hydrology of Ayad River Basin LandUseLandCoverMap 2011 LandUseLandCoverMap 2021 River Discharge Data Locations Satellite Imagery Map 2011 Satellite Imagery Map 2021 Soil Map v2 Unconfined Aquifer Map Satellite Imagery Map Soil Map Topography (DEM) Map
 Map.png)
Related images
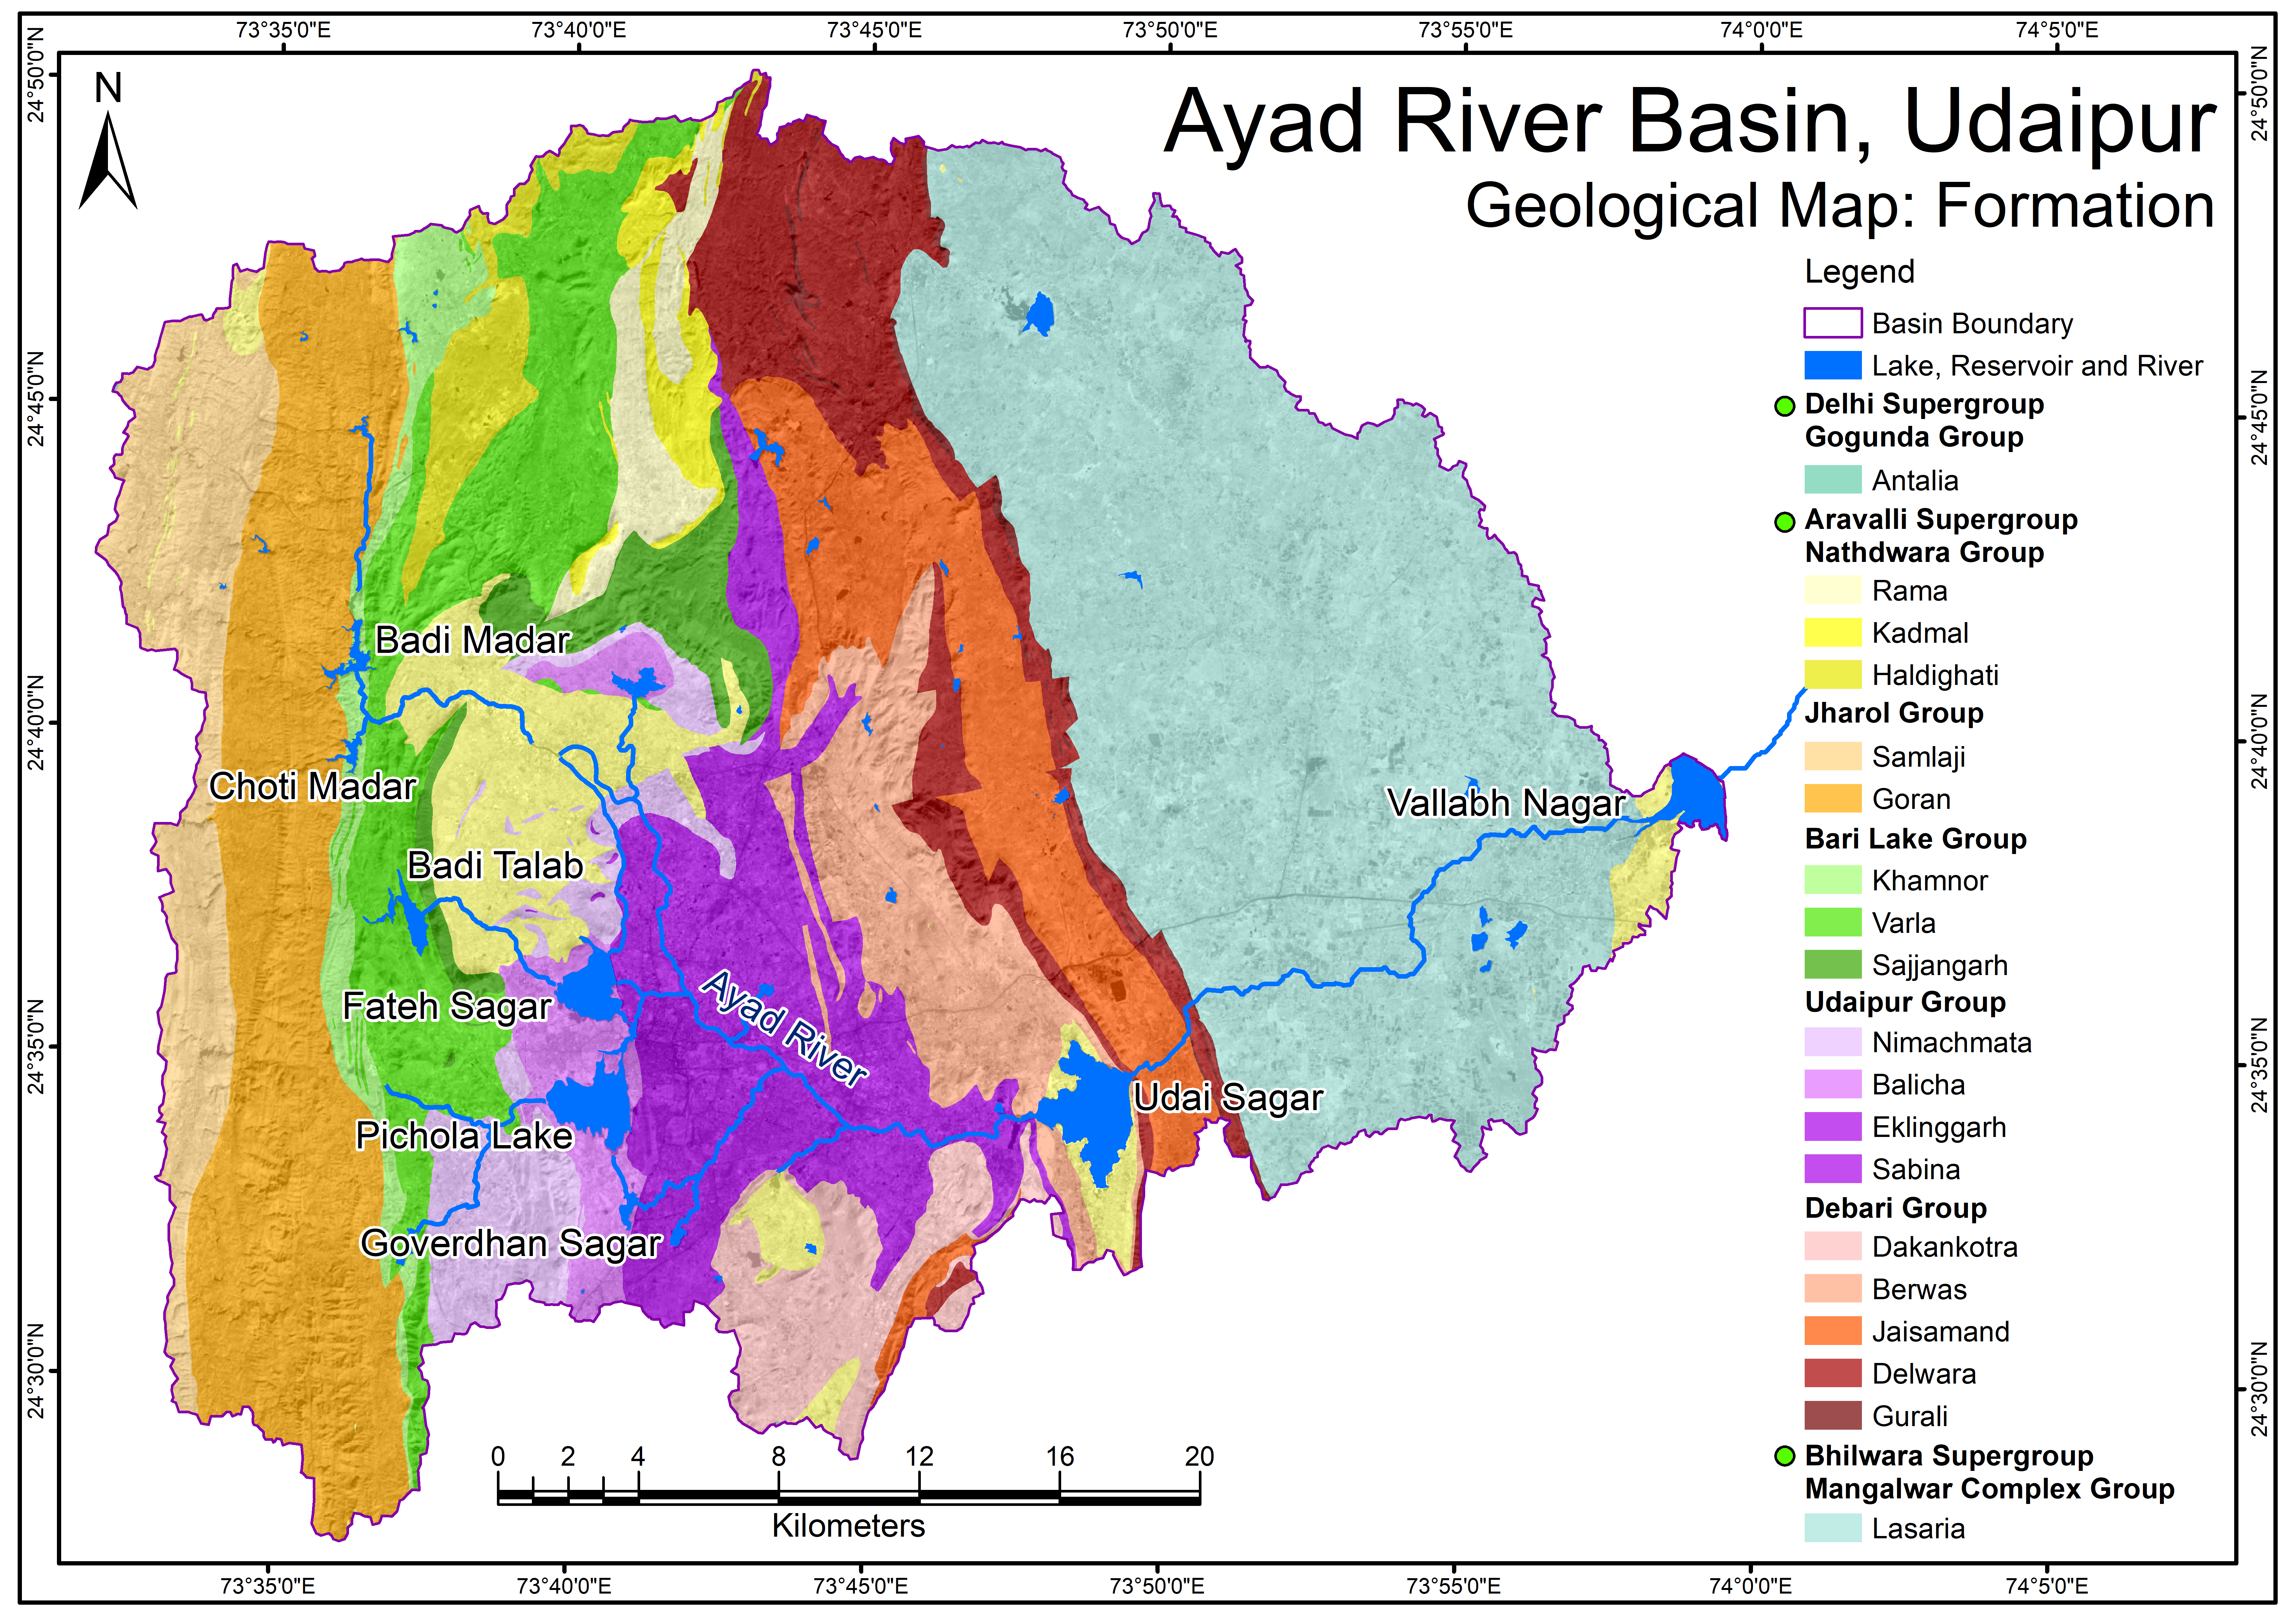
Ayad River Basin Geological Map - Formation
View more
8 Oct 2022
Ayad River Basin Geological Map - Formation
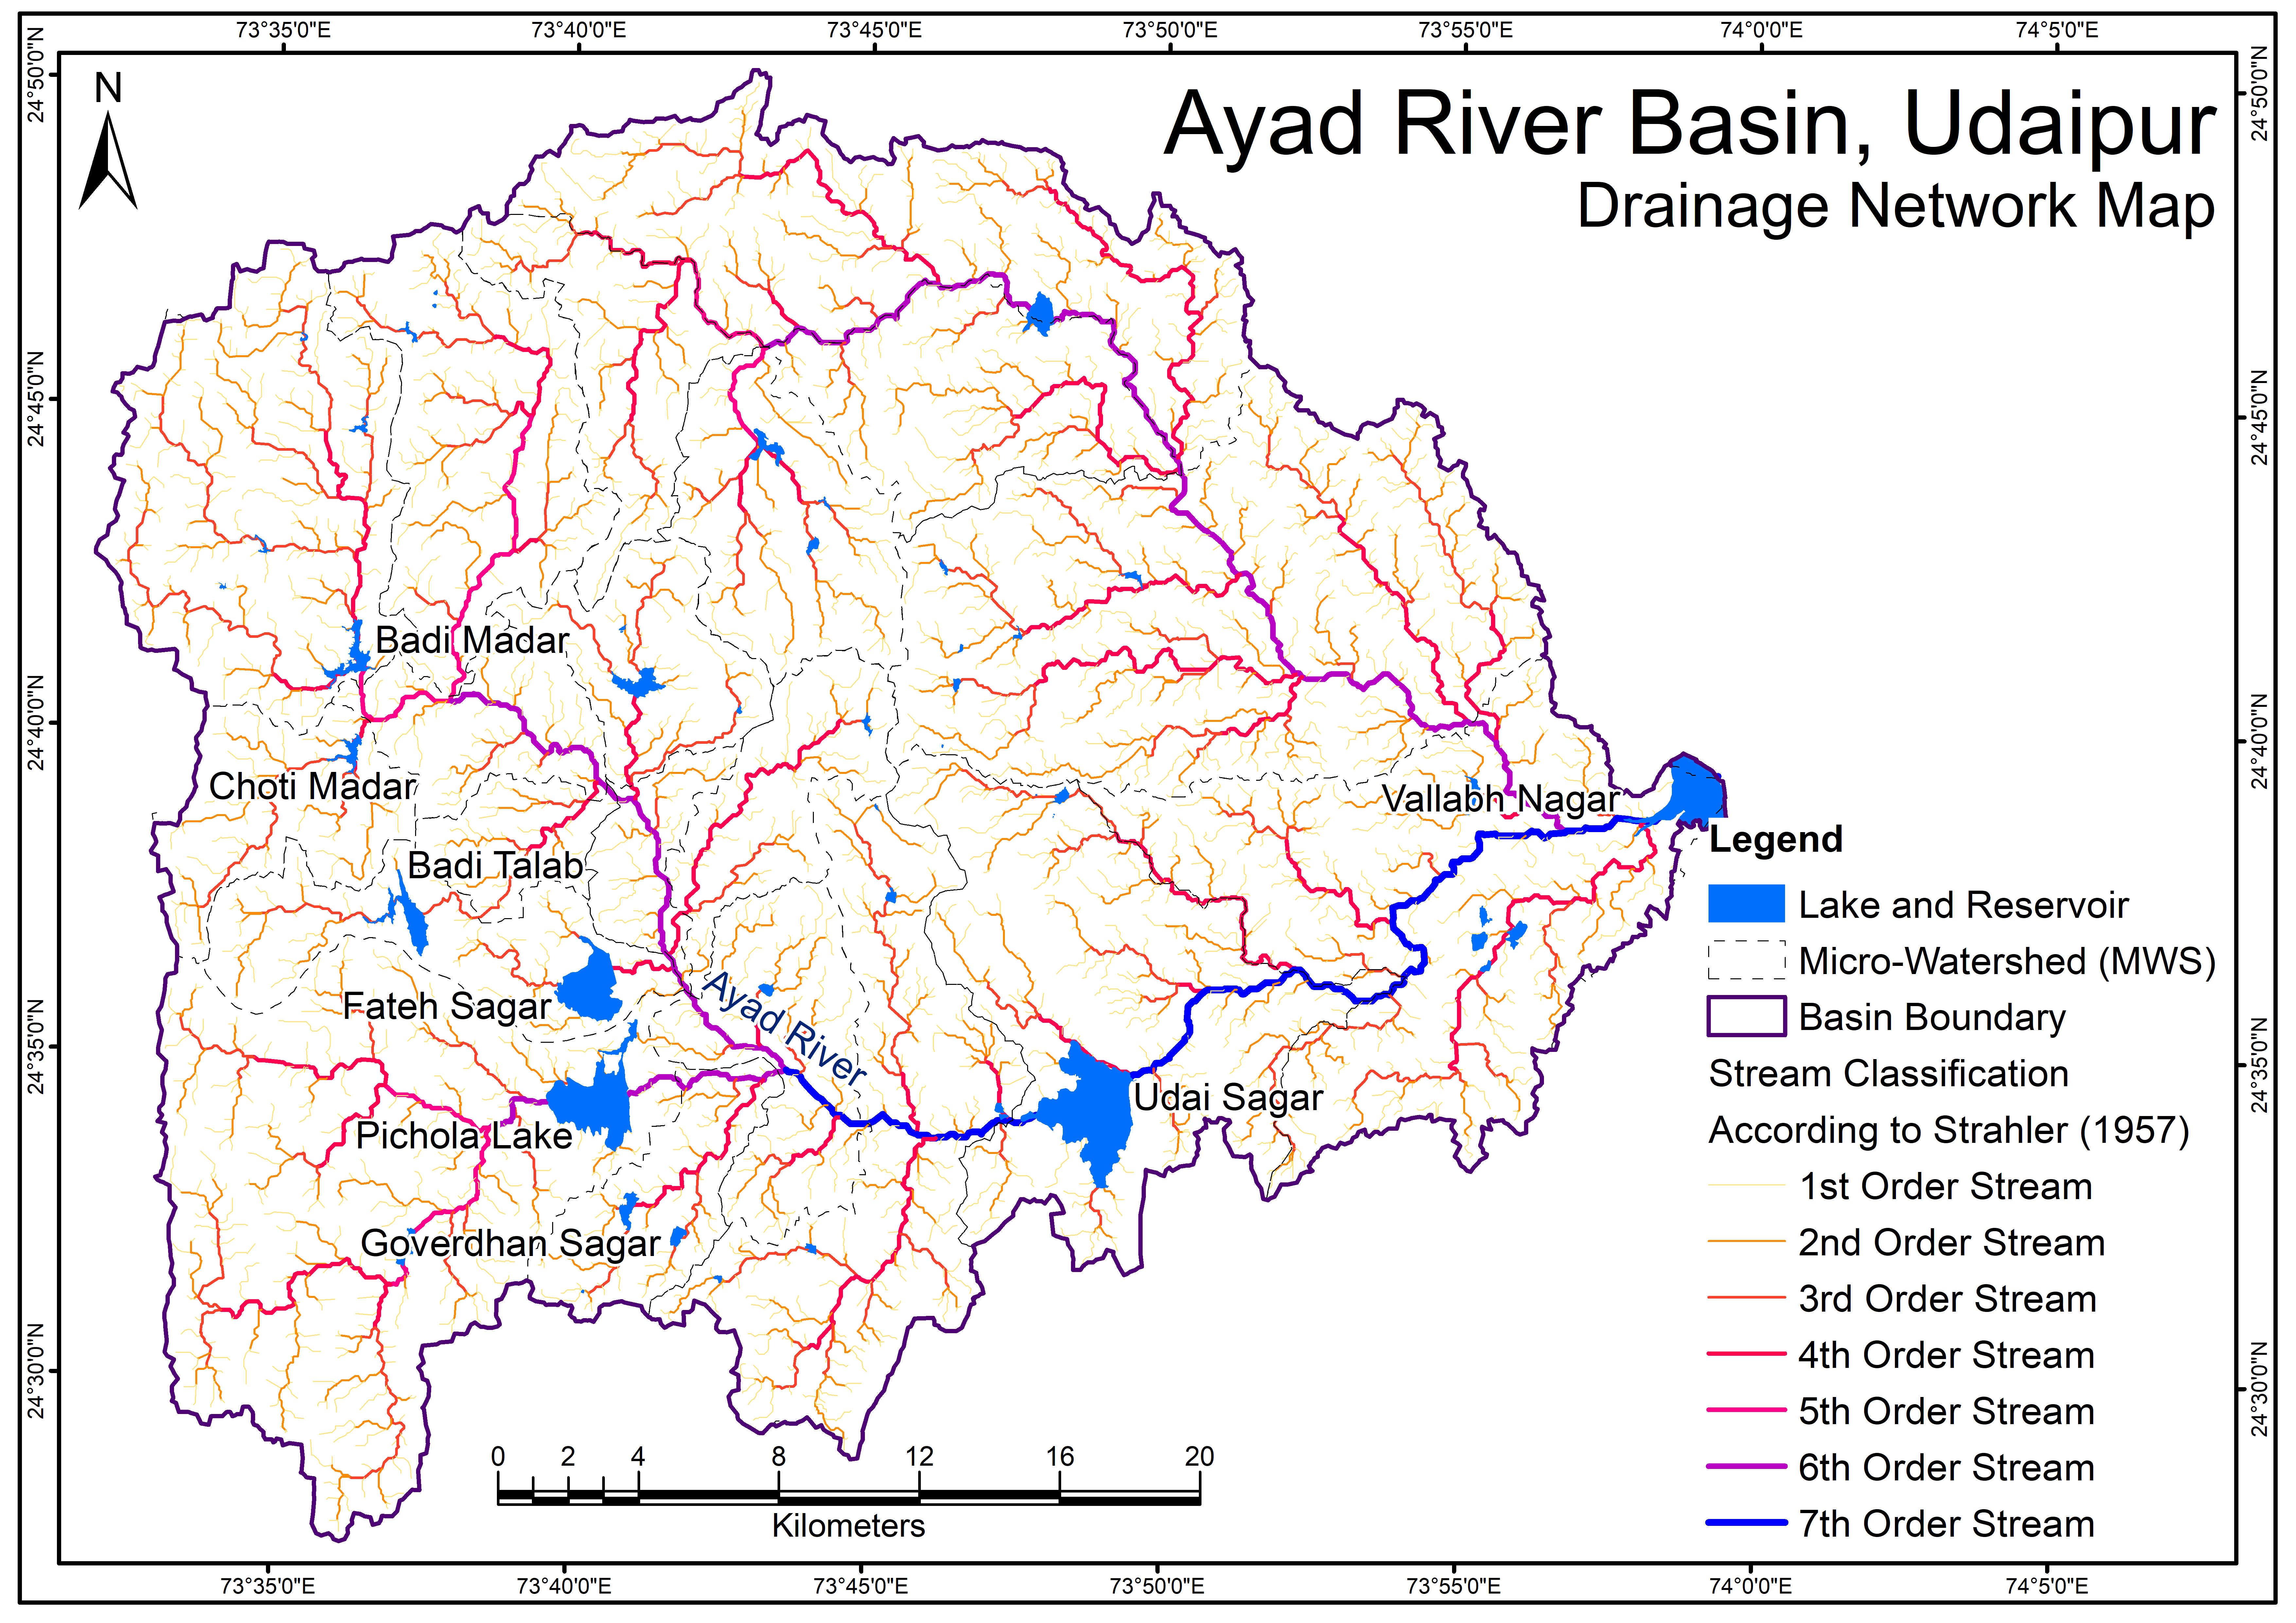
Ayad River Basin Drainage Network Map
View more
12 Oct 2022
Ayad River Basin Drainage Network Map
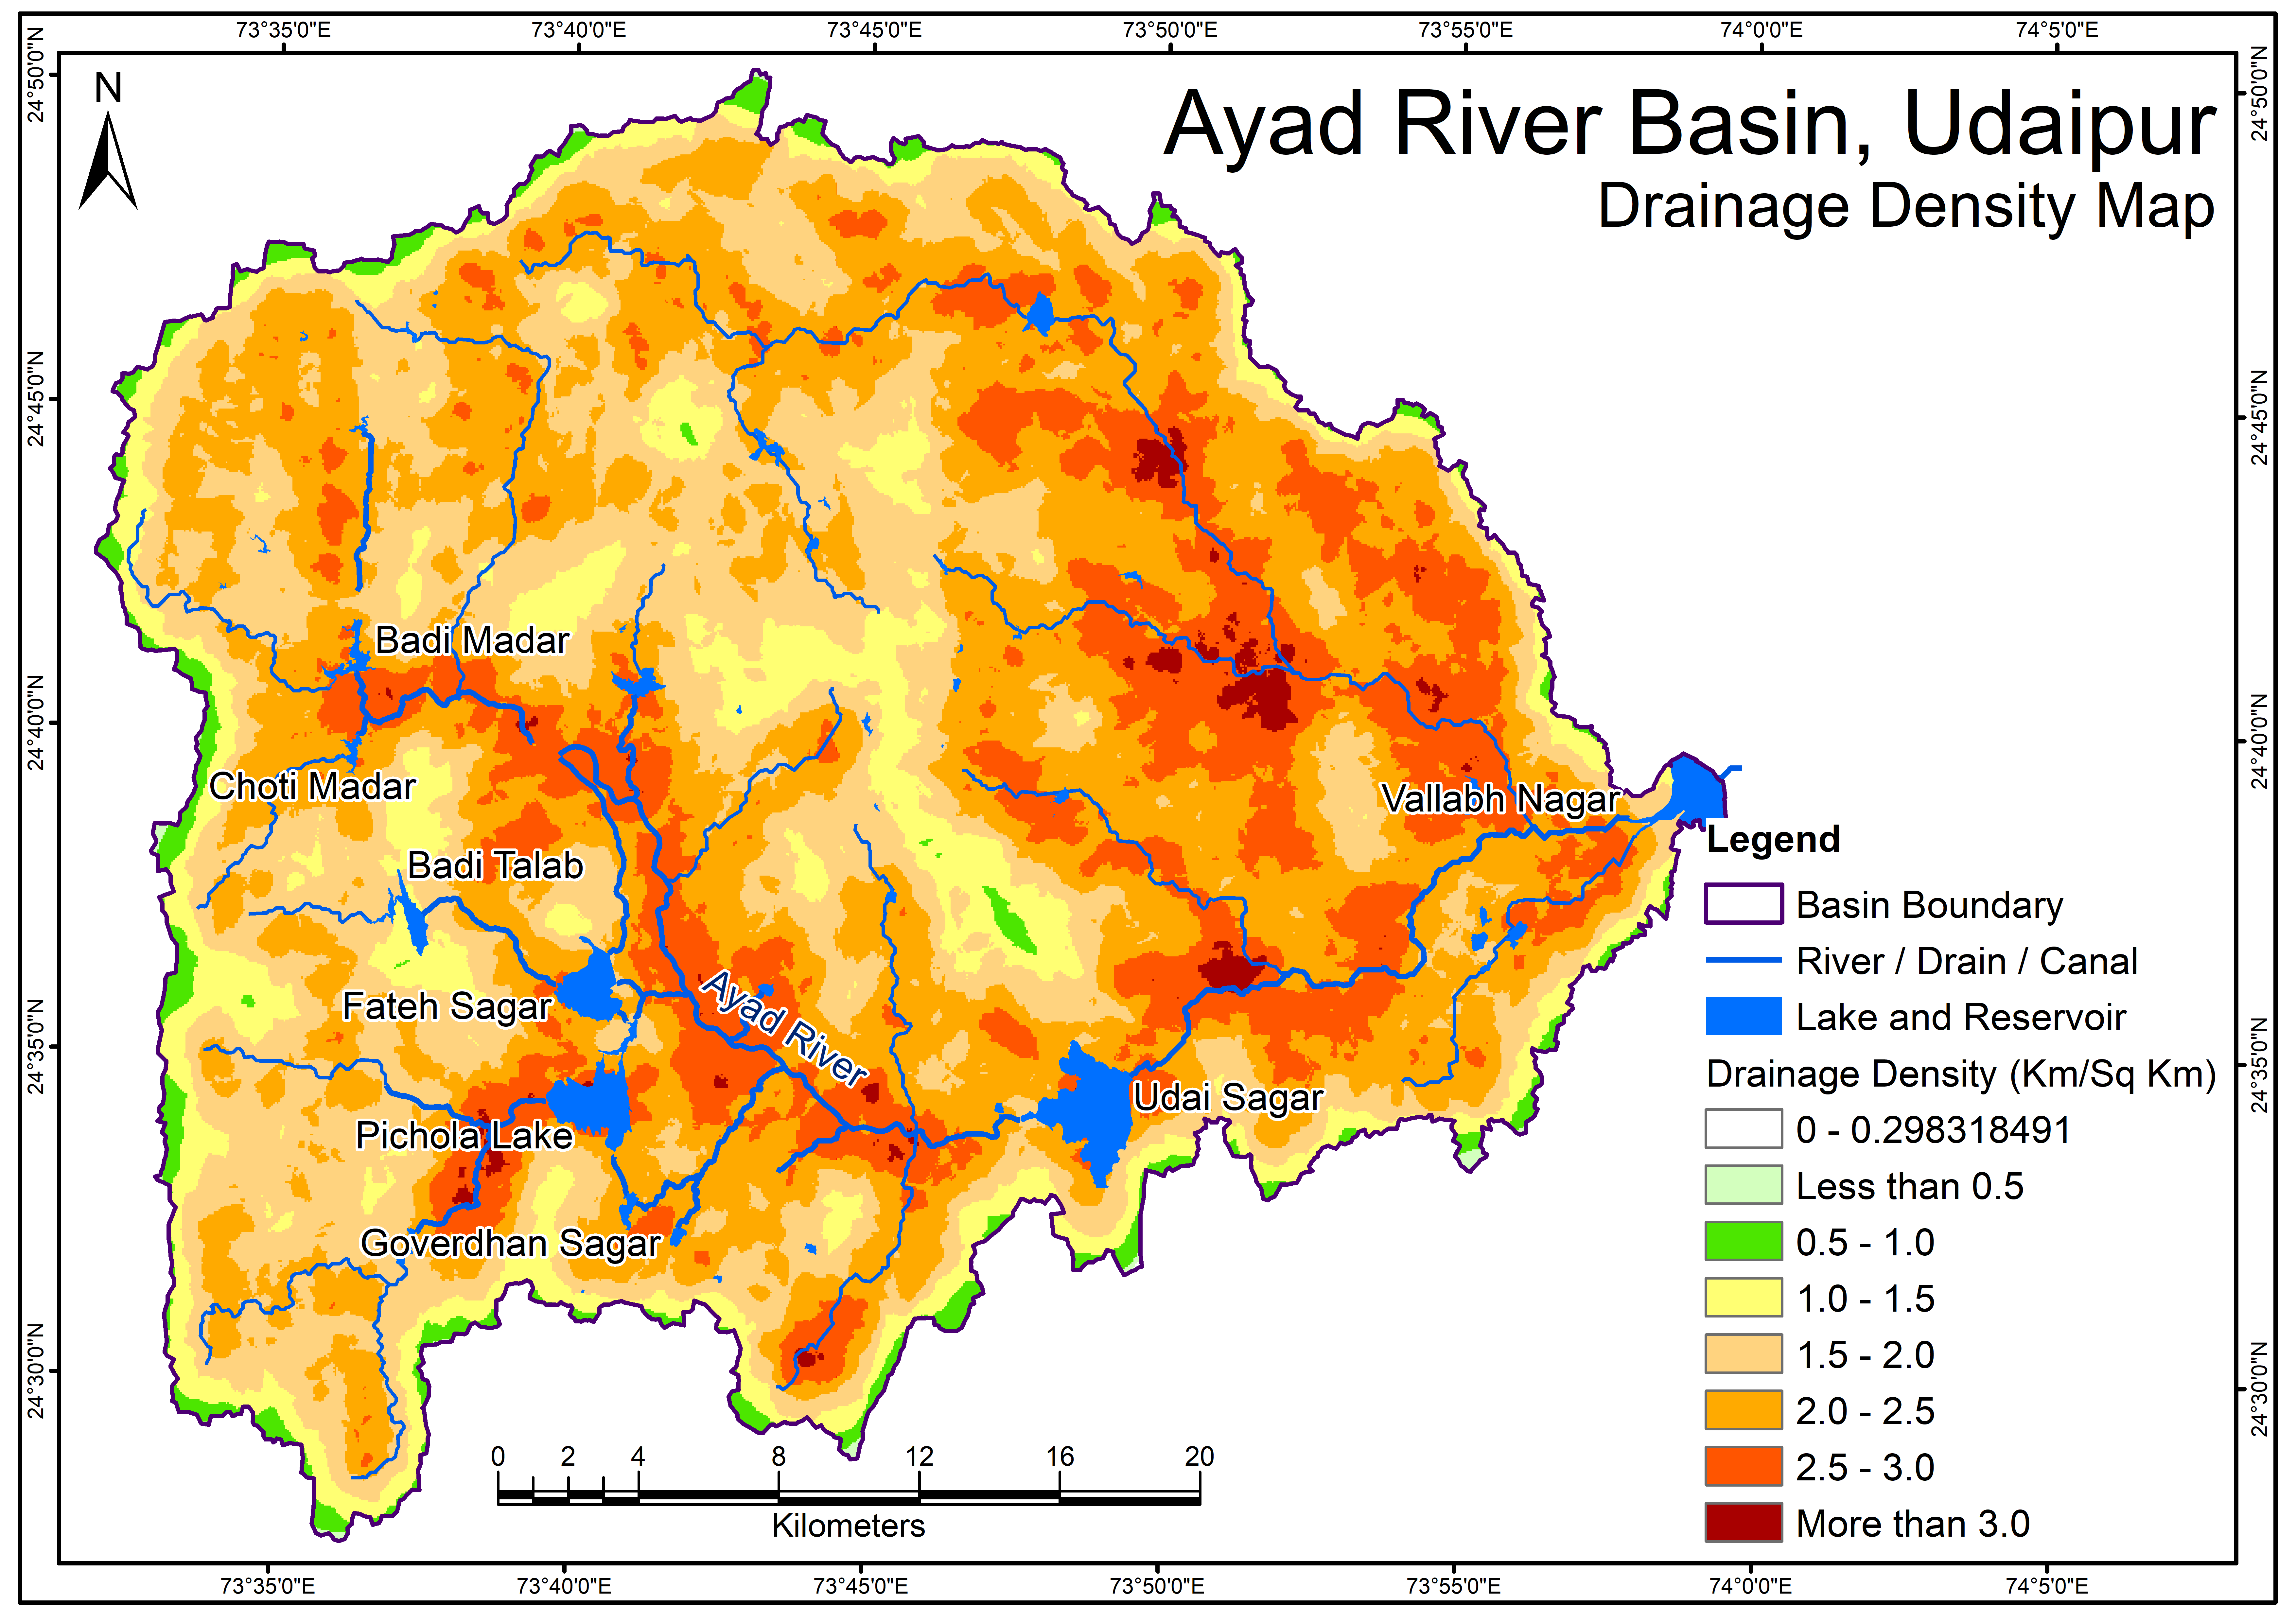
Drainage Density Map
View more
16 Oct 2022
Drainage Density Map
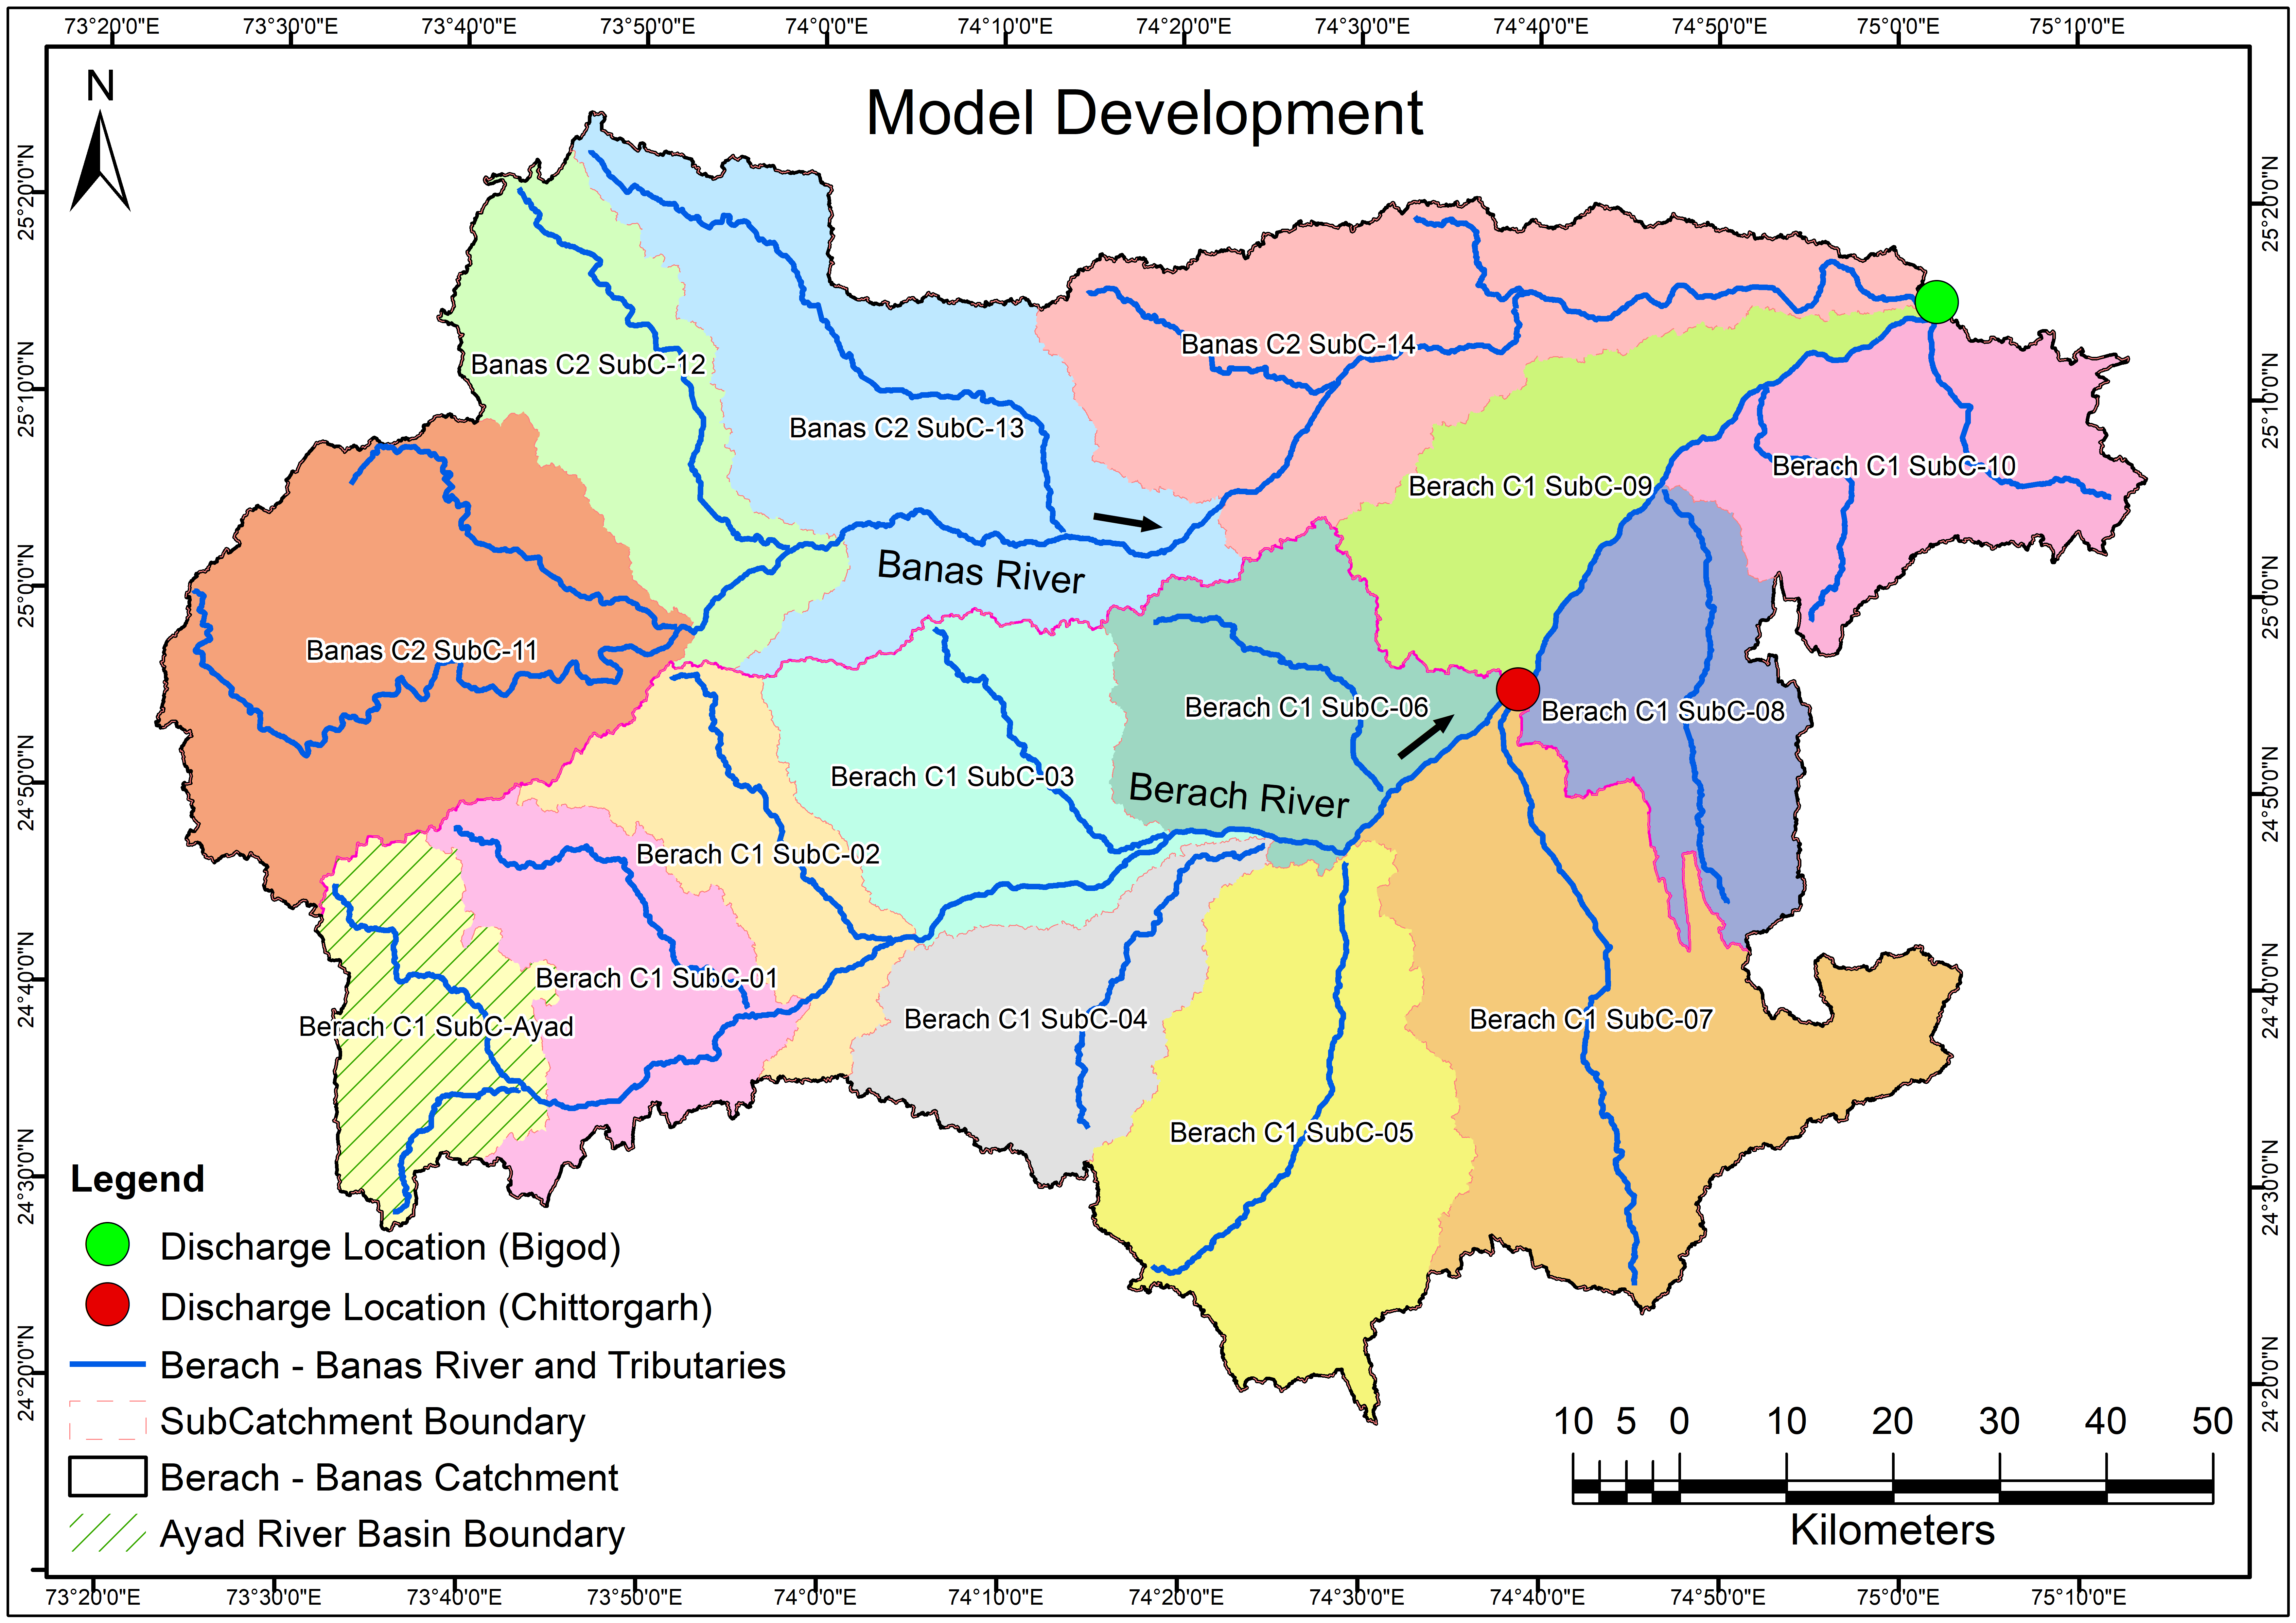
Model Development
View more
16 Oct 2022
Model Development
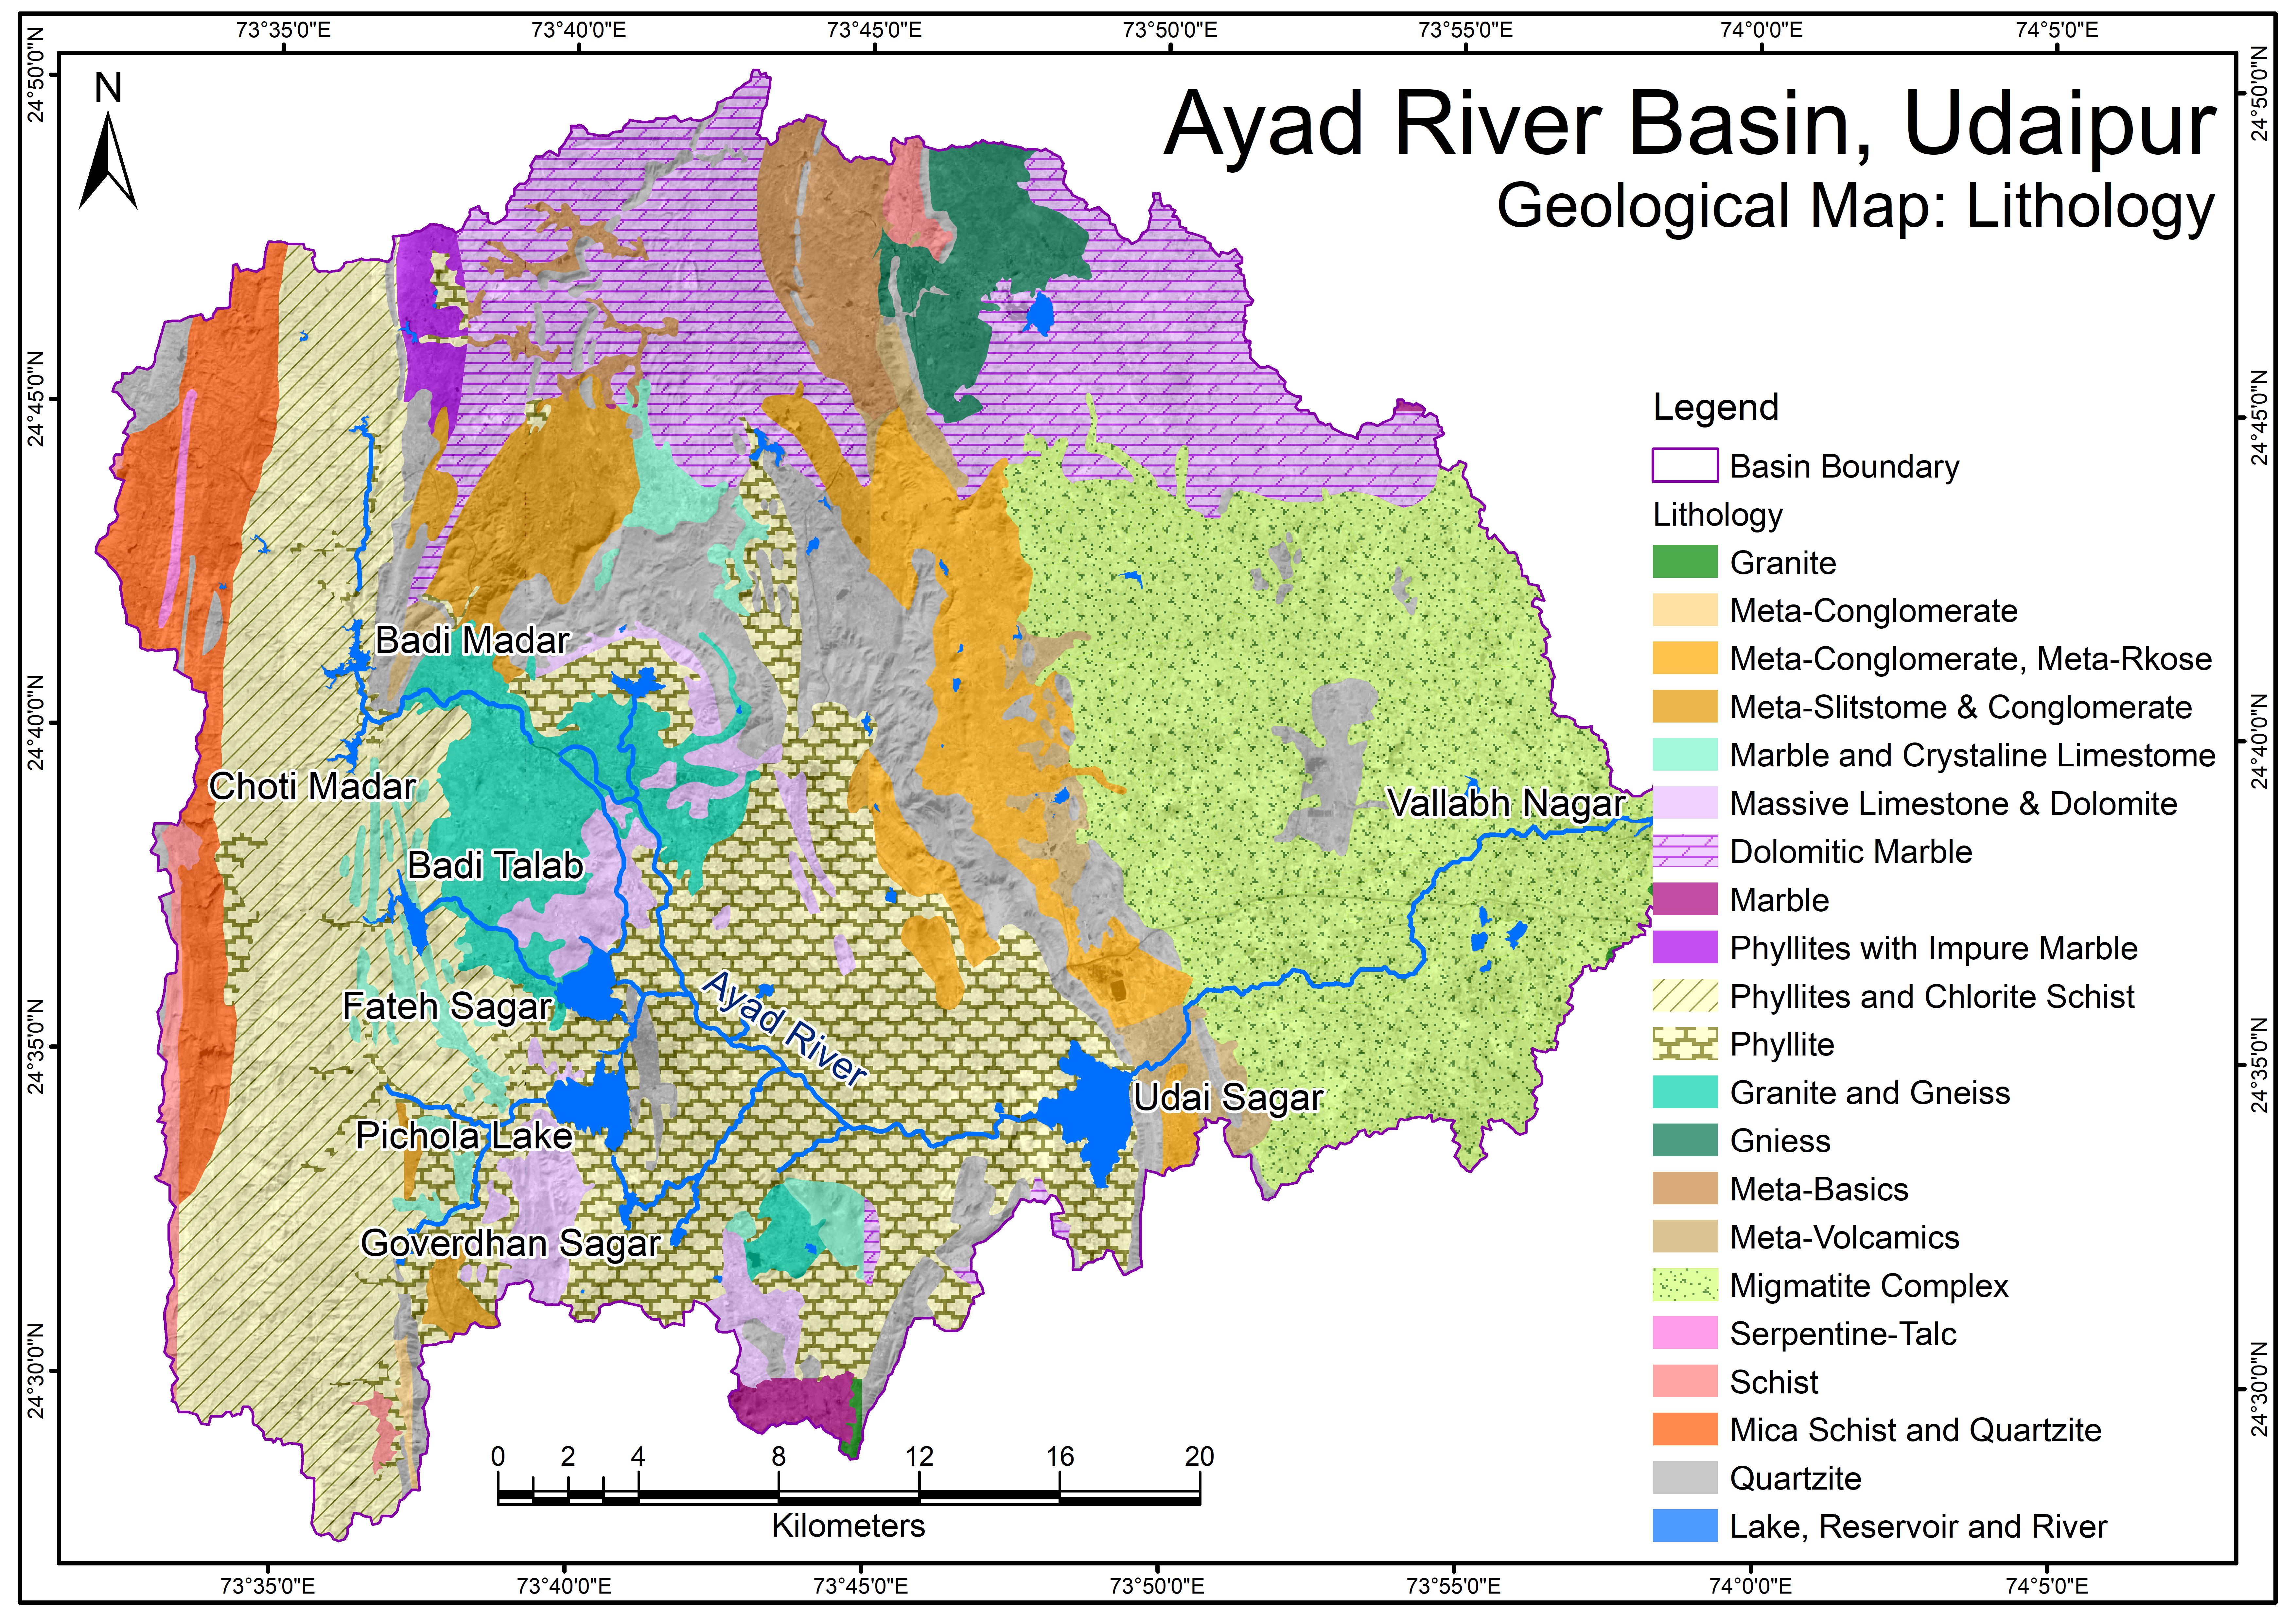
Ayad River Basin Geological Map - Lithology
View more
6 Oct 2022
Ayad River Basin Geological Map - Lithology
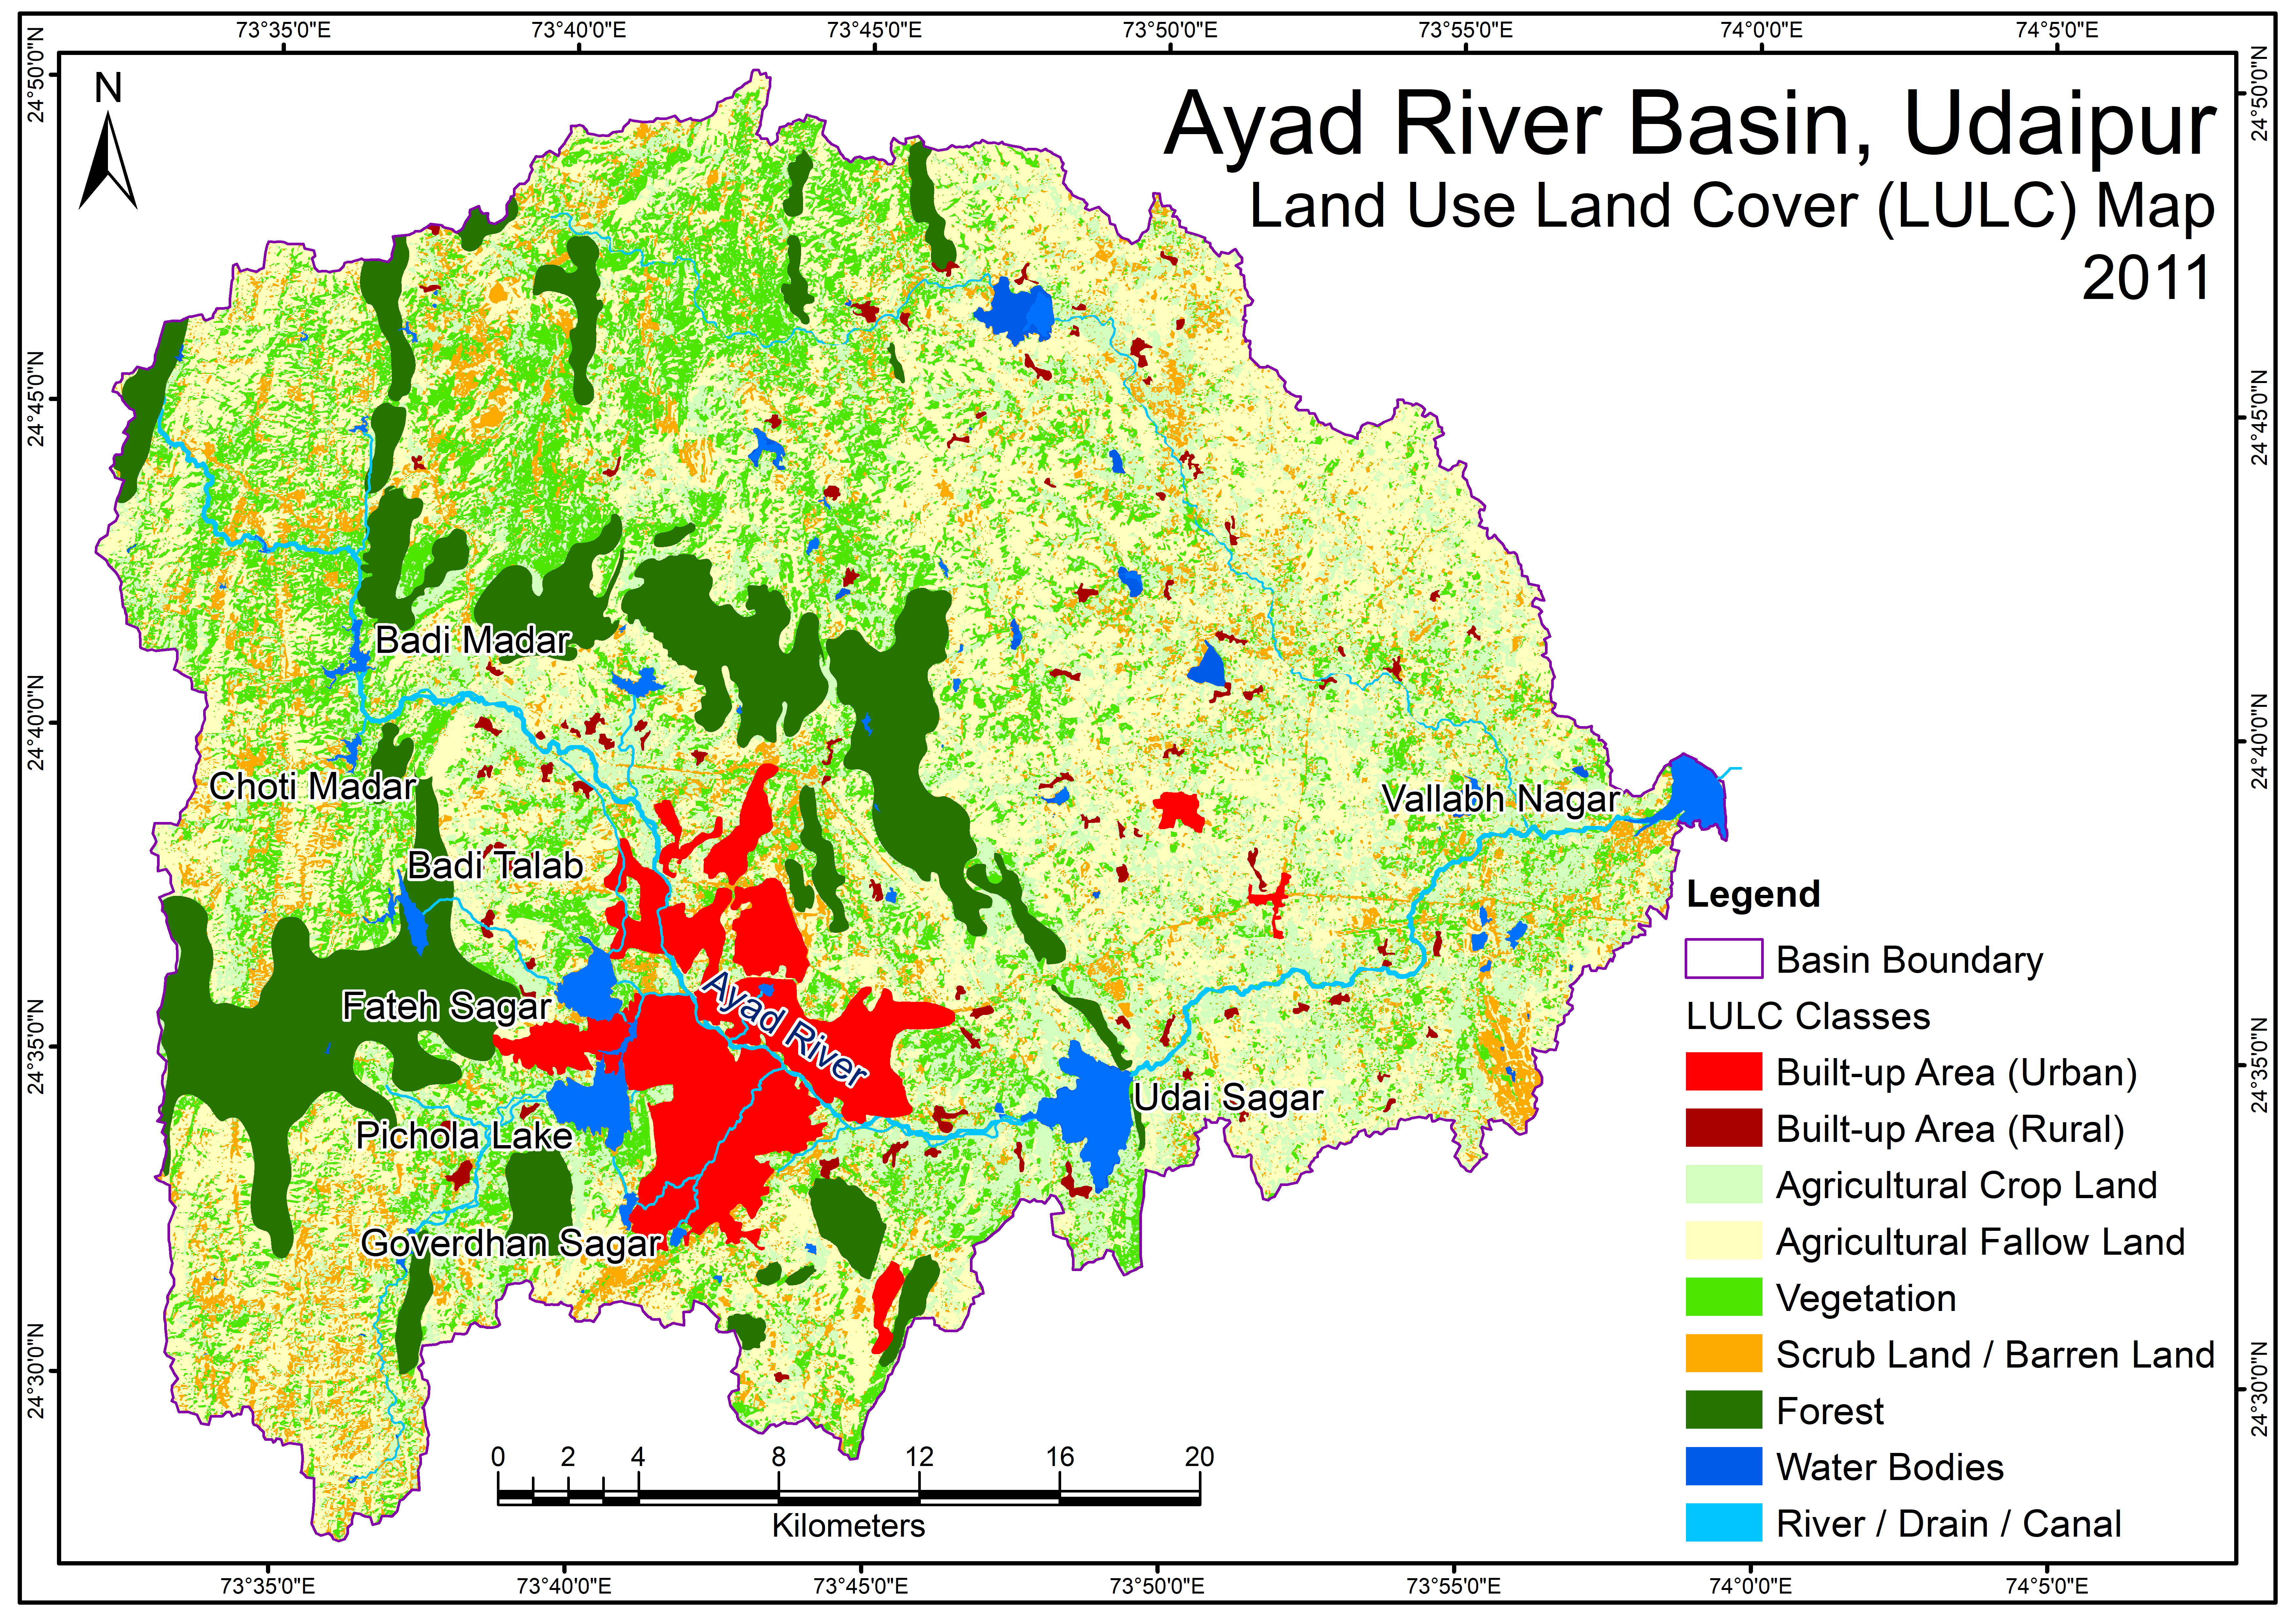
Ayad River Basin LandUseLandCoverMap 2011
View more
22 Sep 2022
Ayad River Basin LandUseLandCoverMap 2011
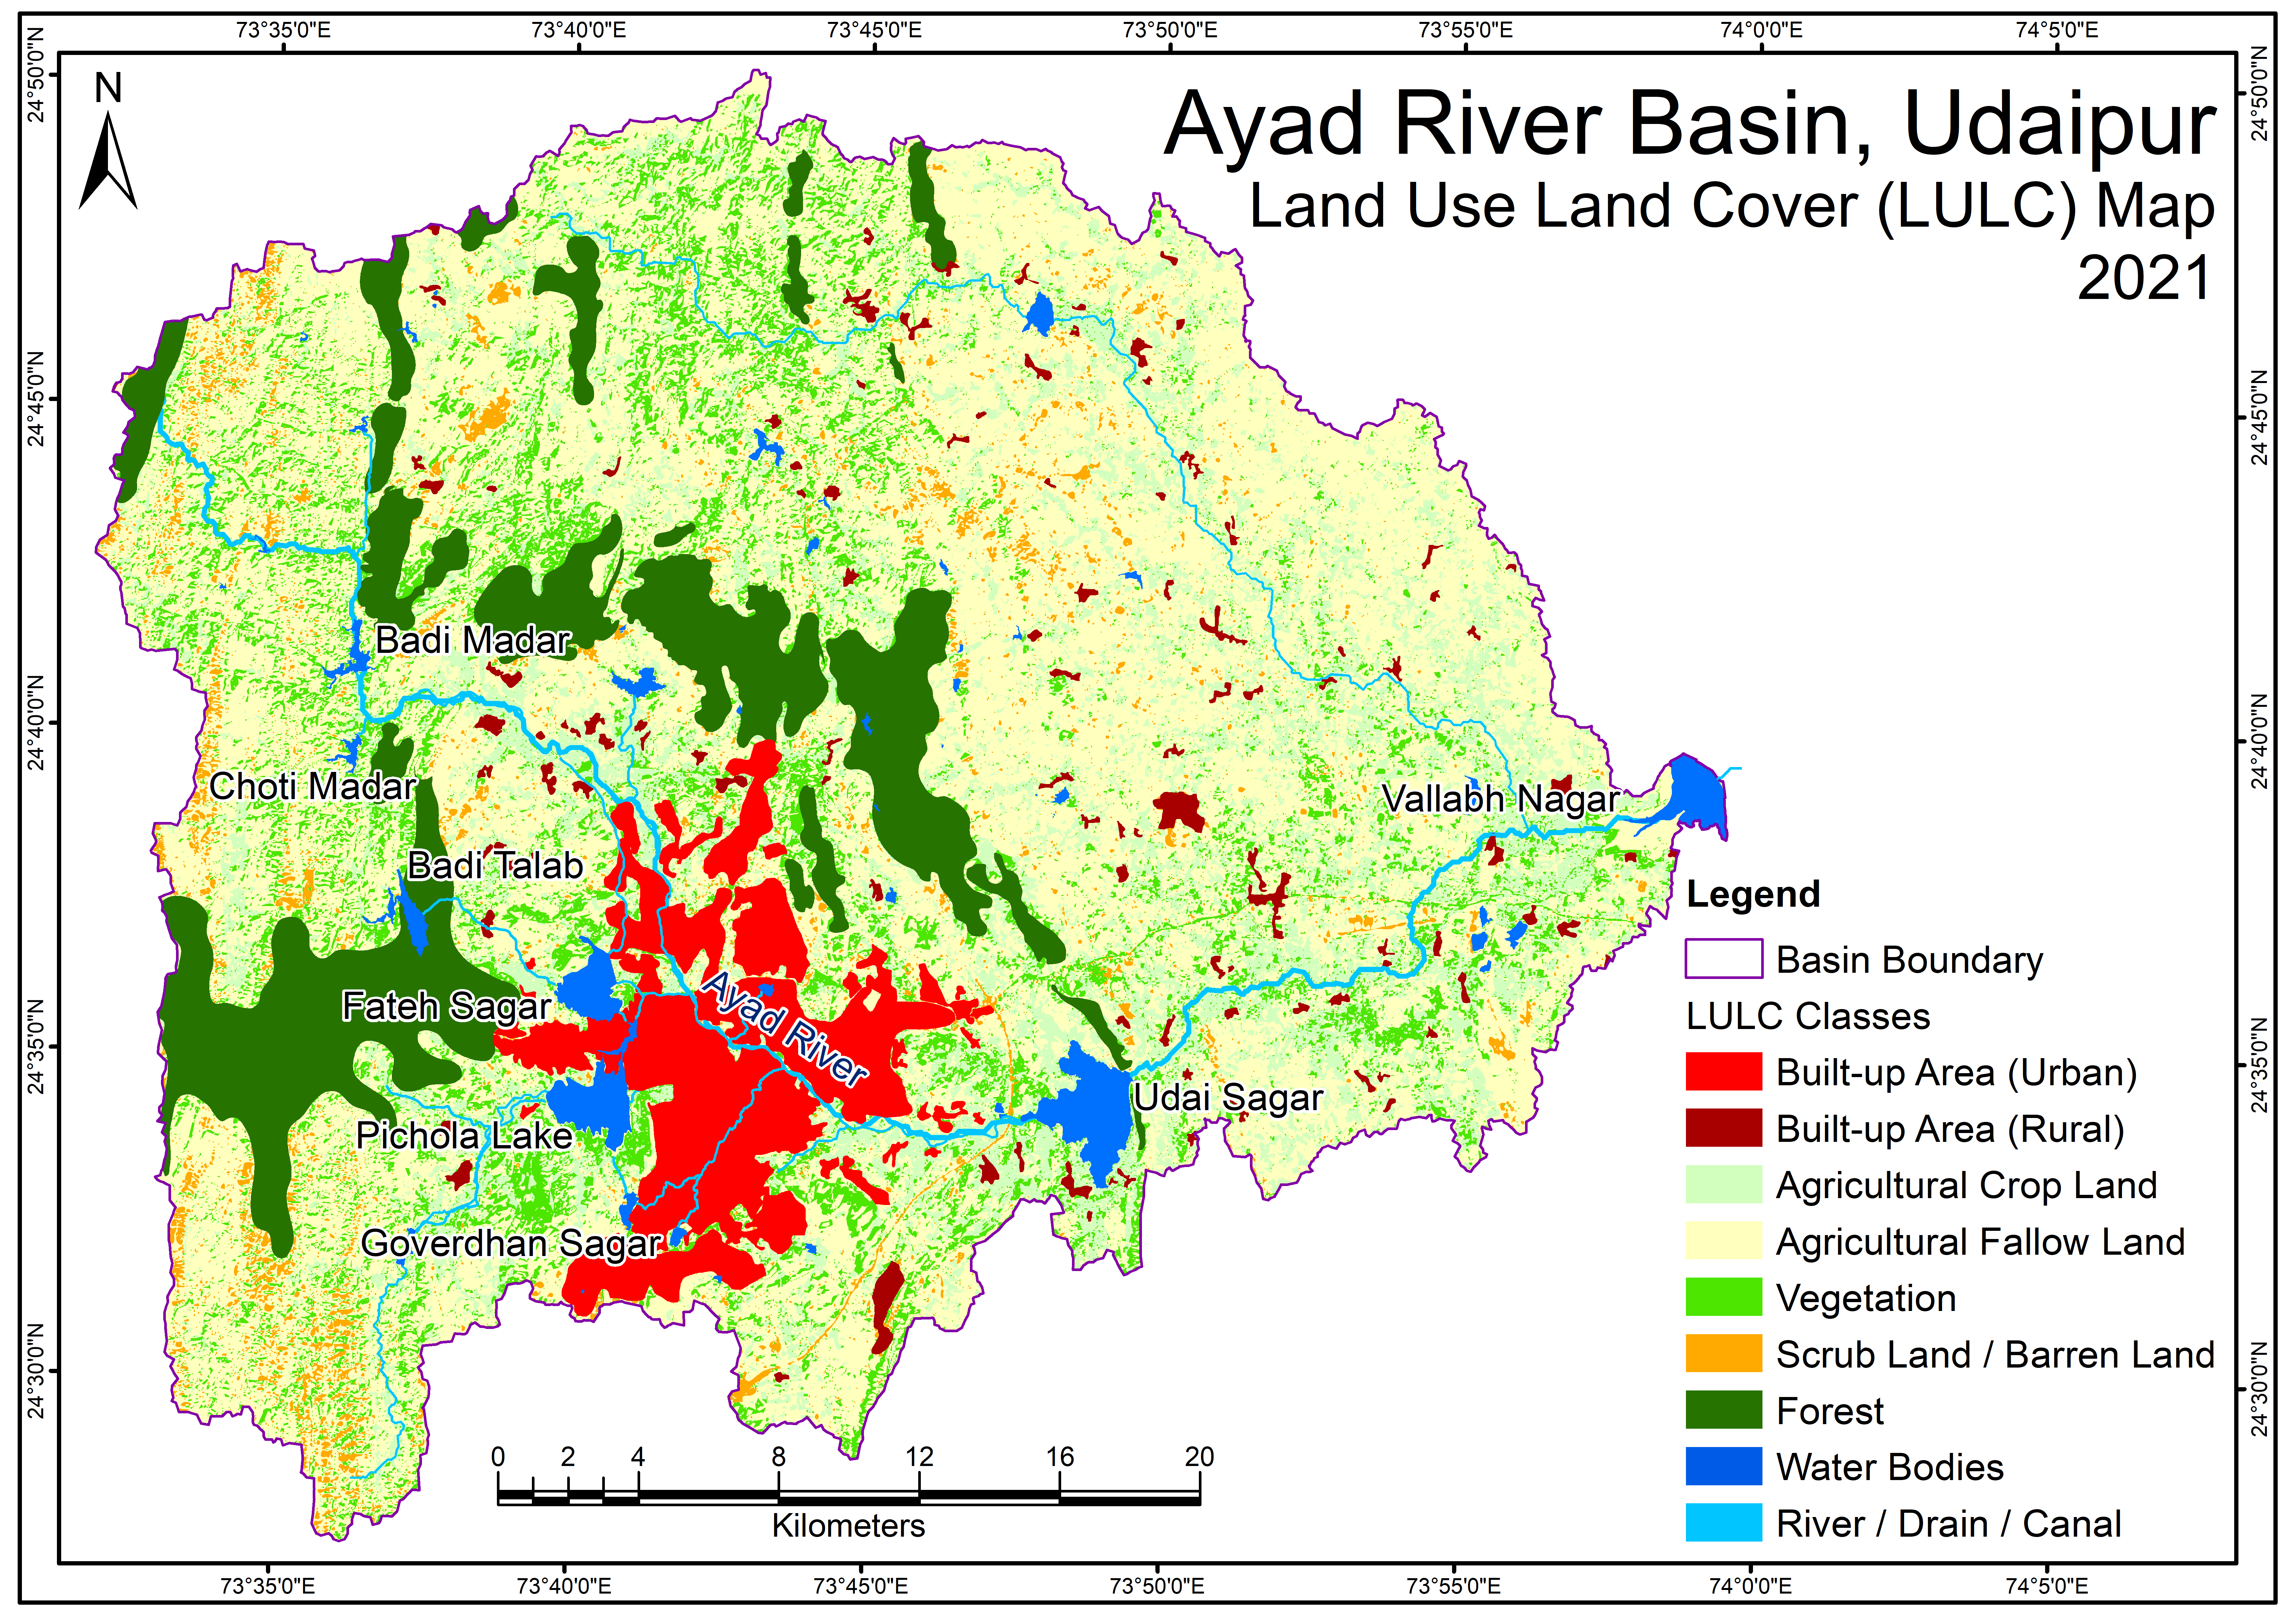
Ayad River Basin LandUseLandCoverMap 2021
View more
12 Sep 2022
Ayad River Basin LandUseLandCoverMap 2021
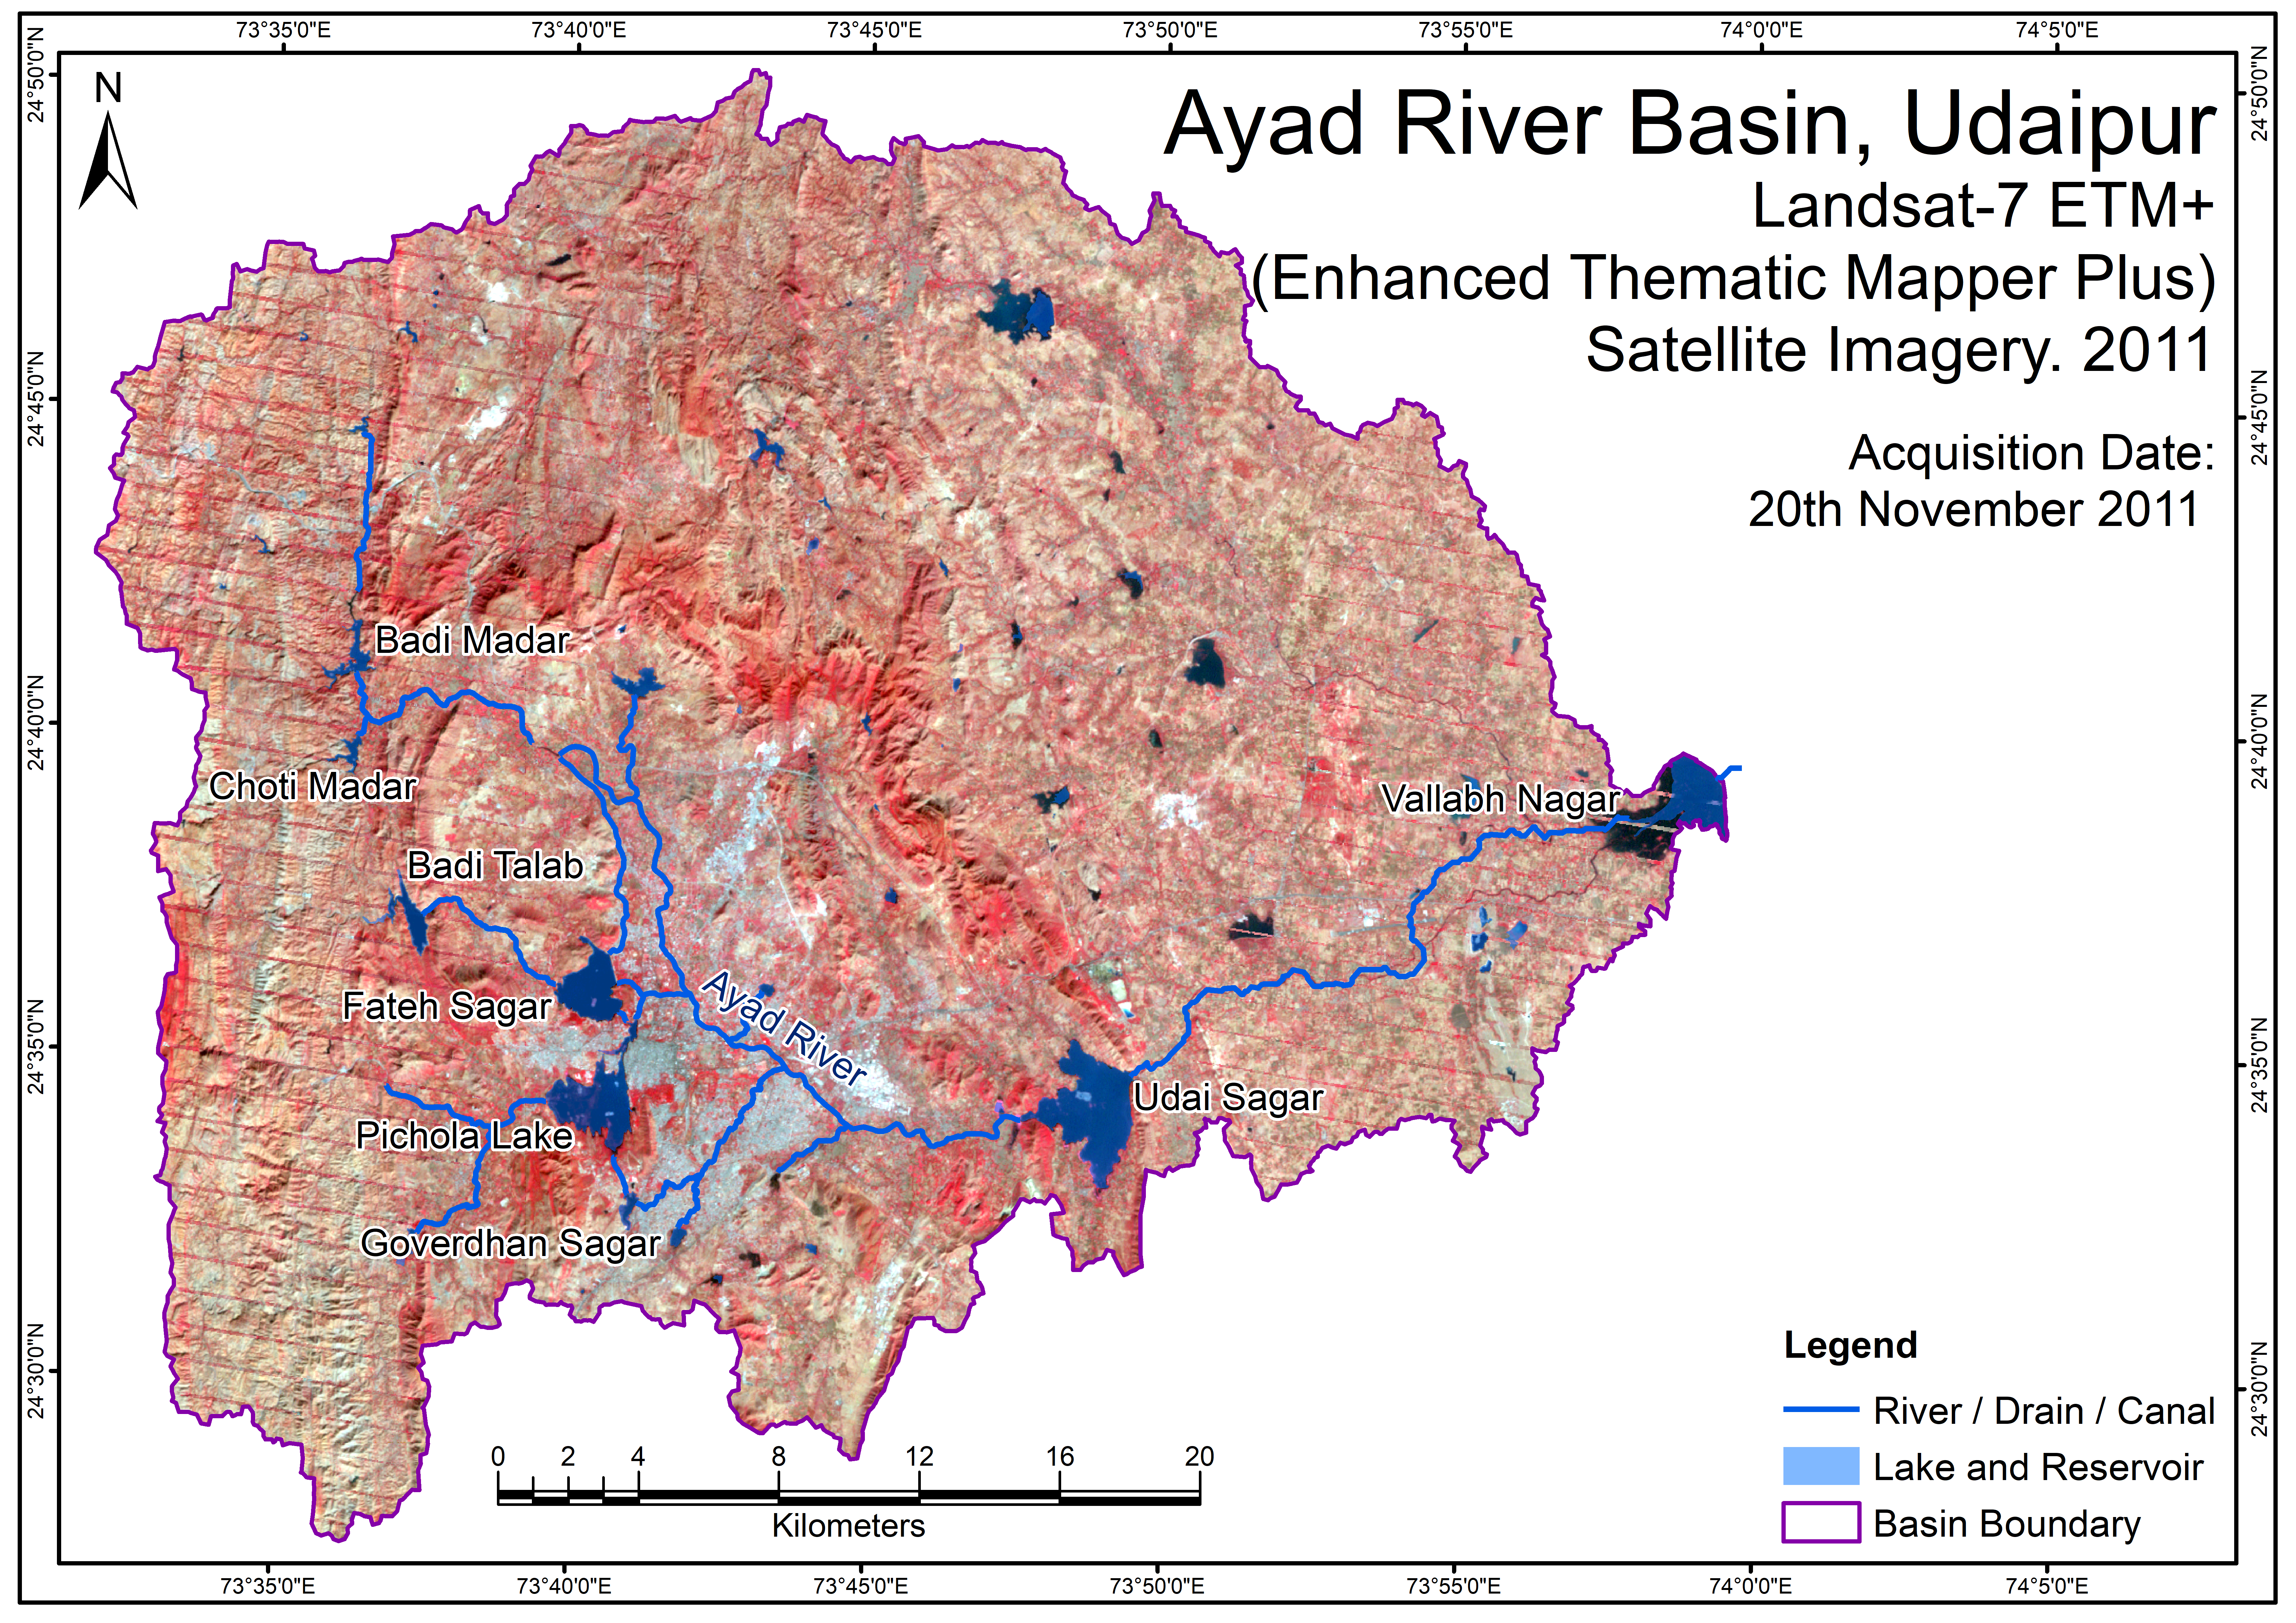
Ayad River Basin Satellite Imagery Map 2011
View more
4 Sep 2022
Ayad River Basin Satellite Imagery Map 2011